- Joined
- 2/3/13
- Messages
- 245
- Points
- 138
Hi guys,
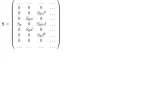
I am pricing options using the multi period binomial model. I got the prices but have to display in a (2N+1)X(N+1) matrix. I have attached a picture. I could not copy paste it in this thread. This is the code i have so far.
N_periods=5; %number of periods
u=1.1; %the upward movement in stock
d=0.9; %the downward movement in stock
r=0.02; %the interest rate per period
S0=100; %initial stock price
strike_price=100;
%************************************************
%create the lattice with stock prices
stock_price=zeros ((2*N_periods)+1,N_periods+1);
for n=1: (N_periods+1)
for m=1:n
stock_price(m,n)=S0*u^(n-m)*d^(m-1);
end;
end;
stock_price
return;
Any help will be greatly appreciated. Thank you very much.
-Abhishek.
")