Hey guys,
i'm trying to learn VBA and just trading strategies in general. my background isn't strong in computing and i haven't written these types of things before. i do have some matlab experience but not enough
so basically, i want to re-create an LTCM type trade. i want to execute a strategy that is betting on convergence for the LIBOR/Tbill spreads when the spread is 1 Zaway from the long term mean.
for instance, i have daily data from 1/2/1987 until 12/24/2007.
the mean spread over the period is 47.5bps and the stdev is 32.9bps.
if the spread goes above, say, 1 Z below or 1 Z above, i want to go short it (bet the spread will increase) and long it (bet the spread will decrease) respectively. i want to stay short/long until the spread returns to 0.5 Zs at which point i want to exit the trade and wait until the next time the spread moves away from its long term mean by 1 Z (we can hpefully replace 1 with "zl" and "zs" to represent the Zscores away from the mean for which i want to long/short respective).
so i want to compute returns for the strategy where those rules are met.
the data is laid out simply:
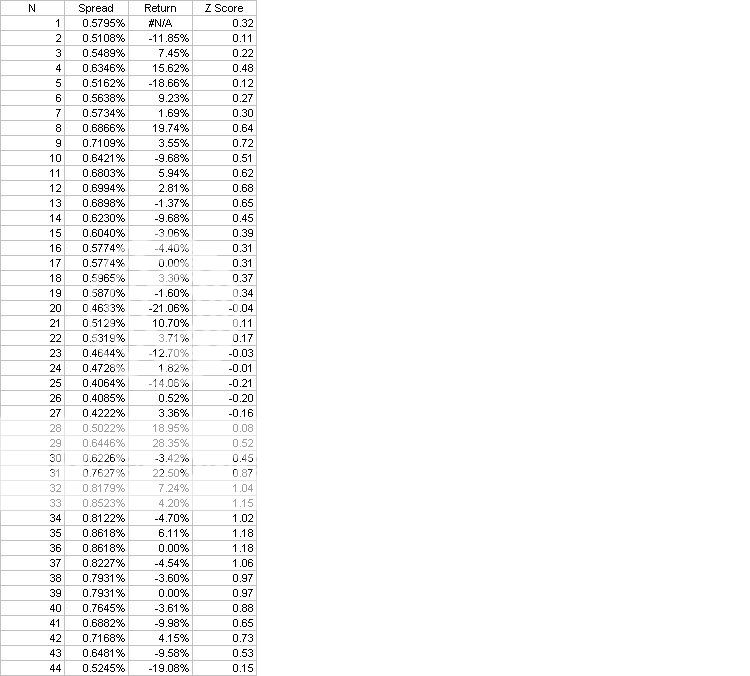
so in this example, i would be long the spread from where N0=32 and simply hold that trade until N1=44. at which point i would calculate the annualized returns = - [Product(1+Return(32:44))^(250/(N1-N0+1)) - 1] (this is negative since the returns assume i'm net short the spread...it would be simply =[product...] if the spread was at -1Z) ... assuming 250 trading day count convention. then, i would wait until the next point that Z <>=1 at which point i'd bet on convergence again according to those above steps.
EDIT: i just noticed that the above example is different than what i actually did. the above example takes return N for ZScore N when in fact i would initiate the position at Zscore N and thus get the returns from N+1 (which is how i actually calculated it)...
I just want to get to learn how to write a VBA code to create this trading strategy. ideally, one input box would just be the Z score to short and another would be the Z score to long (so they wouldn't have to be symmetric).
any thoughts/help would be greatly appreciated. this isn't a homework assignment or anything, i just want to do this to help me learn how to construct this type of test so i can do many many more on my own in VBA.
hopefully, we can all learn through this process.
EXCEL SUMMARY: ...
here is a picture to help visualize the strategy:
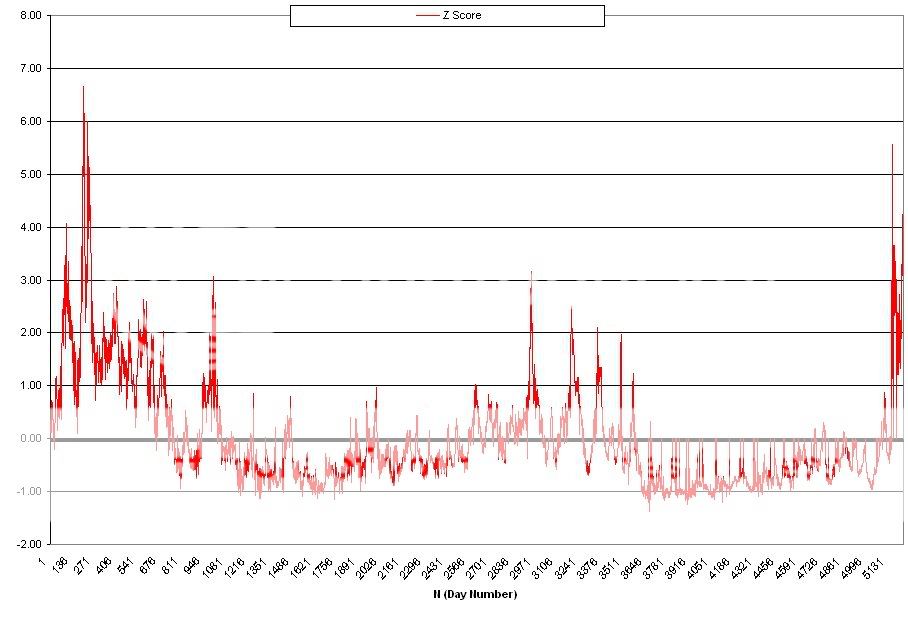
every time the red line crosses +1 or -1, the strategy goes into effect and stays in effect until the red line crosses +.5 or -.5.
so i just tested this without VBA and it is working perfectly but it takes way to many steps and is nowhere near effecient. it has nothing but nested IF(AND(OR(...)..)) type statements and then one final step to make sure the returns all face the correct way (i.e. if the spread is -1Z away it gives a positive return if it goes from -1.1Zs away to -0.90Zs away but gives a negative return if it goes from 1Z away to 1.5Zs away)
the strategy looks absolutely amazing on paper (and i thought of it mostly by myself") yay!!! )
yay!!! )
it gives an annualized total return (not counting financing costs, opporutnity costs etc.) of 234.28% with a st.dev of 15.99 %. if we assume a 10% financing cost and a 6% opportunity cost (from avg 3mo tbill annualized returns), then we get about a 218.28% excess return on about a 15.99% vol (different when you take out the tbill returns but whatever) for an Information Ratio of 13.65
so i want to be able to refine this strategy, but to do that, i think it is WAAAAYYY more efficient to do it in VBA.
thanks,
Barron
EDIT: obviously this is a very very simple algorithm..ideally the trading strategy would use the Zscore to compute a signal that would take X % of the maximum position based upon the Zscore relative to the max (and this wouldn't be a simple linear function either). it would be an S curve where the signal approaches -100% or +100% far quicker at the beginning than it does at the end.....buuuuut, i have to start somewhere, right?
i'm trying to learn VBA and just trading strategies in general. my background isn't strong in computing and i haven't written these types of things before. i do have some matlab experience but not enough
so basically, i want to re-create an LTCM type trade. i want to execute a strategy that is betting on convergence for the LIBOR/Tbill spreads when the spread is 1 Zaway from the long term mean.
for instance, i have daily data from 1/2/1987 until 12/24/2007.
the mean spread over the period is 47.5bps and the stdev is 32.9bps.
if the spread goes above, say, 1 Z below or 1 Z above, i want to go short it (bet the spread will increase) and long it (bet the spread will decrease) respectively. i want to stay short/long until the spread returns to 0.5 Zs at which point i want to exit the trade and wait until the next time the spread moves away from its long term mean by 1 Z (we can hpefully replace 1 with "zl" and "zs" to represent the Zscores away from the mean for which i want to long/short respective).
so i want to compute returns for the strategy where those rules are met.
the data is laid out simply:
so in this example, i would be long the spread from where N0=32 and simply hold that trade until N1=44. at which point i would calculate the annualized returns = - [Product(1+Return(32:44))^(250/(N1-N0+1)) - 1] (this is negative since the returns assume i'm net short the spread...it would be simply =[product...] if the spread was at -1Z) ... assuming 250 trading day count convention. then, i would wait until the next point that Z <>=1 at which point i'd bet on convergence again according to those above steps.
EDIT: i just noticed that the above example is different than what i actually did. the above example takes return N for ZScore N when in fact i would initiate the position at Zscore N and thus get the returns from N+1 (which is how i actually calculated it)...
I just want to get to learn how to write a VBA code to create this trading strategy. ideally, one input box would just be the Z score to short and another would be the Z score to long (so they wouldn't have to be symmetric).
any thoughts/help would be greatly appreciated. this isn't a homework assignment or anything, i just want to do this to help me learn how to construct this type of test so i can do many many more on my own in VBA.
hopefully, we can all learn through this process.
EXCEL SUMMARY: ...
here is a picture to help visualize the strategy:
every time the red line crosses +1 or -1, the strategy goes into effect and stays in effect until the red line crosses +.5 or -.5.
so i just tested this without VBA and it is working perfectly but it takes way to many steps and is nowhere near effecient. it has nothing but nested IF(AND(OR(...)..)) type statements and then one final step to make sure the returns all face the correct way (i.e. if the spread is -1Z away it gives a positive return if it goes from -1.1Zs away to -0.90Zs away but gives a negative return if it goes from 1Z away to 1.5Zs away)
the strategy looks absolutely amazing on paper (and i thought of it mostly by myself
yay!!! )it gives an annualized total return (not counting financing costs, opporutnity costs etc.) of 234.28% with a st.dev of 15.99 %. if we assume a 10% financing cost and a 6% opportunity cost (from avg 3mo tbill annualized returns), then we get about a 218.28% excess return on about a 15.99% vol (different when you take out the tbill returns but whatever) for an Information Ratio of 13.65
so i want to be able to refine this strategy, but to do that, i think it is WAAAAYYY more efficient to do it in VBA.
thanks,
Barron
EDIT: obviously this is a very very simple algorithm..ideally the trading strategy would use the Zscore to compute a signal that would take X % of the maximum position based upon the Zscore relative to the max (and this wouldn't be a simple linear function either). it would be an S curve where the signal approaches -100% or +100% far quicker at the beginning than it does at the end.....buuuuut, i have to start somewhere, right?
